
- To improve/maintain good physical and mental health and wellbeing, including sexual function and sleep.
- For research about exercise and quality of life improvements see the following link:
- For an overview of systematic reviews of the effectiveness of physical activity interventions for improving depression, anxiety and distress see the following link:
- For a video about exercise and depression see the following link:
- For a video about exercise and sexual function see the following link:
- For articles about exercise and sleep see the following links:
- To increase physical and mental "energy" levels and decrease general fatigue.
- For a video about how exercise effects the brain see the following link:
- For an article that discusses the impact of exercise on the brain see the following link:
- For some research about psychological responses to exercise see the following link:
- To improve/maintain physical stamina so that physical activities can be undertaken for greater durations/intensities and the rate of perceived exertion of undertaking physical activities is reduced/maintained.
- To protect against/prevent/aid recovery from illness/injury.
- For an article about preventing illness this see the following link:
- For a video about exercise and the impact on immunity see the following link:
- For an article about how exercise could help broken bones heal faster see the following link:
- For an article about how exercise may increase pain tolerance see the following link:

- For image/body shape reasons.
- To help maintain a healthy bodyweight / appropriate amount of lean body mass.
- To help lose excess visceral abdominal (belly) fat (via aerobic exercise) / maintain the loss.
- For the research abstract about this see the following link:
- To support weight / body fat mass loss when combined with an appropriate calorie deficit diet.
- To contribute to minimising the risk of early death and contribute to maximising life expectancy and particularly healthy life expectancy (aka healthspan).
- To prevent early aging and support minimising the impact of aging.
- For an video about the impact of exercise on aging see the following link:
- For an article about exercise and aging see the following link:
- For some research about the impact of exercise on the aging of human cells see the following link:
- To help manage illness/aging.
- Including helping to manage/reduce pain for some conditions. For an article with an example see the following link:
- Including helping with addictions and mental illness. See the following research re alcohol addiction:
- Because it can save money. See the following link to an article about this:

- Conservatively estimated, physical inactivity cost health-care systems international $ (INT$) 53·8 billion worldwide in 2013, of which $31·2 billion was paid by the public sector, $12·9 billion by the private sector, and $9·7 billion by households. In addition, physical inactivity related deaths contribute to $13·7 billion in productivity losses, and physical inactivity was responsible for 13·4 million disability-adjusted life-years (DALYs) worldwide.
- For the UK total direct costs were $1.9 billion:
- Public sector direct costs $1,544,700,000, private sector/third party direct costs $133,196,000 and household direct costs $172,044,000.
- See the following link to the research:
- The total National Health Service (NHS) conservative costs attributable to prolonged sedentary behaviour (≥6 hours/day) in the UK in 2016–2017 were £0.8 billion, which included expenditure on coronary vascular disease (£424 million), type 2 diabetes (£281 million), colon cancer (£30 million), lung cancer (£19 million) and endometrial cancer (£7 million). After adjustment for potential double-counting, the estimated total was £0.7 billion. If prolonged sedentary behaviour was eliminated, 69,276 UK deaths might have been avoided in 2016. See the following link to the research abstract:
- Because we think we ought to/we enjoy it/we are addicted to it.
- See the following link for an article about why we feel good after exercise:
- See the following link for an article about exercise addiction:
- It can bring people together to enjoy shared activities.
- It can contribute to building stronger communities.
- It may protect against some of the illnesses associated with alcohol consumption. See the following link to a preview of the research:
- For a video summary about a lot of the above see the following link:
The benefits quantified

- Leisure time physical activity level and hazard ratios for mortality and gains in life expectancy after age 40.
- For comparison, long-term cigarette smoking reduces life expectancy by approximately 10 y.
- A physical activity level of 0.1–3.74 MET-h/wk, equivalent to brisk walking for up to 75 min/wk, was associated with a gain of 1.8 (95% CI: 1.6–2.0) y in life expectancy relative to no leisure time activity (0 MET-h/wk). Higher levels of physical activity were associated with greater gains in life expectancy, with a gain of 4.5 (95% CI: 4.3–4.7) y at the highest level (22.5+ MET-h/wk, equivalent to brisk walking for 450+ min/wk).
- The points shown represent the HR (A) or years of life gained (B) for each of the physical activity categories examined, and the vertical lines represent the 95% CIs for that physical activity category. The reference category for both (A) and (B) is 0.0 MET-h/wk of leisure time physical activity. The lines connecting the points help to illustrate the dose–response relationship between physical activity and risk of mortality; the shape of the association shown here is similar to that obtained using spline modelling. HRs were calculated in models stratified by study that used age as the underlying time scale. Multivariable models were adjusted for gender, alcohol consumption (0, 0.1–14.9, 15.0–29.9, 30.0+ g/d), education (did not complete high school, completed high school, post-high-school training, some college, completed college), marital status (married, divorced, widowed, unmarried), history of heart disease, history of cancer, BMI (<18 .5="" 18.5="" 20="" 22.5="" 25="" 27.5="" 30="" 40="" adjusted="" after="" age="" and="" at="" baseline="" current="" curves="" derived="" direct="" expectancy="" for="" former="" gained="" kg="" life="" m2="" never="" of="" participants="" smoking="" status="" survival="" ul="" using="" were="" who="" y="" years="">
- https://journals.plos.org/plosmedicine/article?id=10.1371/journal.pmed.1001335

- Number of Preventable Deaths and Equivalent Proportion of Total Deaths by Added Amount of moderate-to-vigorous physical activity (MVPA) Among US Adults Aged 40 to 85 Years or Older, 2003 to 2006 National Health and Nutrition Examination Survey.
- Hazard ratios were estimated using Cox proportional hazard regression models and the proportional hazards assumption was confirmed for moderate-to-vigorous physical activity intensity (MVPA). Hazard ratios (95% CIs) were used to generate the population attributable fractions (PAFs). When calculating the PAFs, physical activity levels for participants identified as having frailty or needing special equipment to walk were held constant. Bars represent 95% CIs for both the estimated number of deaths and the proportion of total deaths. Hazard ratios and the estimated number of deaths per year were adjusted for age, sex, race and ethnicity, education level, body mass index, diet quality, alcohol consumption, smoking status, self-reported diabetes, heart disease, heart failure, stroke, cancer, chronic bronchitis, emphysema, mobility limitations, and general health. The number of deaths per year was computed using the 2003 annual mortality for US adults aged 40 to 84 years. Models included US population and study design weights to account for the complex survey. Sample weights also included poststratification adjustments from loss of observations attributable to missing accelerometry data, and all participants were eligible for mortality linkage through the National Death Index.
- aTotal number of minutes per day recorded by the accelerometer that were at or above the cutpoint of 760 counts per minute4 (ie, MVPA).
- Source:

- The percentages given in the infographic appear to relate to the percentage reductions in incidence of the health risks when at least the minimum public health guidance (UK and USA) amounts of physical activity are undertaken. Doing more should provide further improvements to these numbers.
- Since the above infographic was produced new research has been published which appears to further validate and add to some of the above quantifications. Some of the key outcomes of this research can be seen in the following chart:

- The above chart shows the association between meeting the 2018 physical activity guidelines for Americans and all cause and cause specific mortality from the three specific diseases shown in the chart title. Estimates are from the fully adjusted model that includes the covariates of sex, age, race/ethnicity, education, marital status, body mass index, smoking, alcohol intake, and chronic conditions. Whisker markers in the chart represent 95% confidence intervals.
- Muscle strengthening physical activity was defined in this study as physical activities specifically designed to strengthen muscles, such as lifting weights or doing calisthenics undertaken ≥2 times/week.
- Aerobic physical activity was defined in this study as ≥150 minutes of light to moderate intensity activity each week, or ≥75 minutes of vigorous intensity activity, or greater than or equal to an equivalent combination.
- Vigorous intensity activity gave additional benefits but no quantification of the additional benefit was provided.
- Aerobic physical activity had the following additional (to those shown on the chart) beneficial hazard ratio associations with the following other cause specific mortalities (95% confidence intervals in brackets):
- Accidents and injuries 0.82 (0.73 to 0.93) = 18% less.
- Alzheimer’s disease 0.74 (0.62 to 0.87) = 26% less.
- Diabetes mellitus 0.63 (0.53 to 0.74) = 37% less.
- Influenza and pneumonia 0.55 (0.44 to 0.68) = 45% less.
- Nephritis, nephrotic syndrome, or nephrosis 0.48 (0.40 to 0.59) = 52% less.
- Source:
- https://www.bmj.com/content/370/bmj.m2031
- It should be noted that the muscle strengthening, aerobic and the both categorisation groups in this study by definition will include people doing varying amounts of physical activity greater than the inclusion criteria minimums. The study appears not to have set any maximum cut off points so it seems likely that people doing more than the minimums will have improved the overall hazard ratios for the groups as a whole.
- For an article about the impact of exercise on cancer see the following link:
- https://theconversation.com/cancer-heres-the-role-exercise-plays-from-prevention-to-treatment-228546
- Further to the above: "Engaging regularly in moderate to vigorous physical activity is associated with a 31% risk reduction of community-acquired infectious disease and 37% risk reduction in infectious disease mortality." Source:
- Further to the above: Non-linear relationship between physical activity and severe COVID-19 illness (A) and death due to COVID-19 (B). Source:

- Muscle-strengthening activities were associated with a 10–17% lower risk of CVD, total cancer, diabetes, lung cancer and all-cause mortality independent of aerobic activities among adults.

- Non-linear dose–response meta-analysis of the associations between muscle-strengthening activities and all-cause mortality, cardiovascular disease (CVD), total cancer and diabetes. Muscle-strengthening activities were modelled with restricted cubic splines in a random-effects dose–response model. The black line indicates the spline model and dashed lines represent 95% confidence intervals. RR, relative risk. Source:
- Results from newer research than all of the above that generally validates it (apart from no association between cancer mortality and cardiovascular exercise) is as follows:
- Mean age at the follow-up questionnaire was 71.3 (IQR 66–76) years, 52.6% female, with mean body mass index of 27.8 (SD 4.9) kg/m2. Weightlifting was associated with a 9% lower risk of all-cause mortality (HR=0.91 (95% CI 0.88 to 0.94)) and CVD mortality (0.91 (95% CI 0.86 to 0.97)) after adjusting for MVPA. Joint models revealed that adults who met aerobic MVPA recommendations but did not weightlift had a 32% lower all-cause mortality risk (HR=0.68 (95% CI 0.65 to 0.70)), while those who also reported weightlifting 1–2 times/week had a 41% lower risk (HR=0.59 (95% CI 0.54 to 0.64)), both compared with adults reporting no aerobic MVPA or weightlifting. Without adjustment for MVPA, weightlifting was associated with lower cancer mortality (HR=0.85 (95% CI 0.80 to 0.91)). Source:
- Results from newer research than the above that examines the associations between cardiorespiratory fitness in youth and the incidence of site-specific cancer in men:
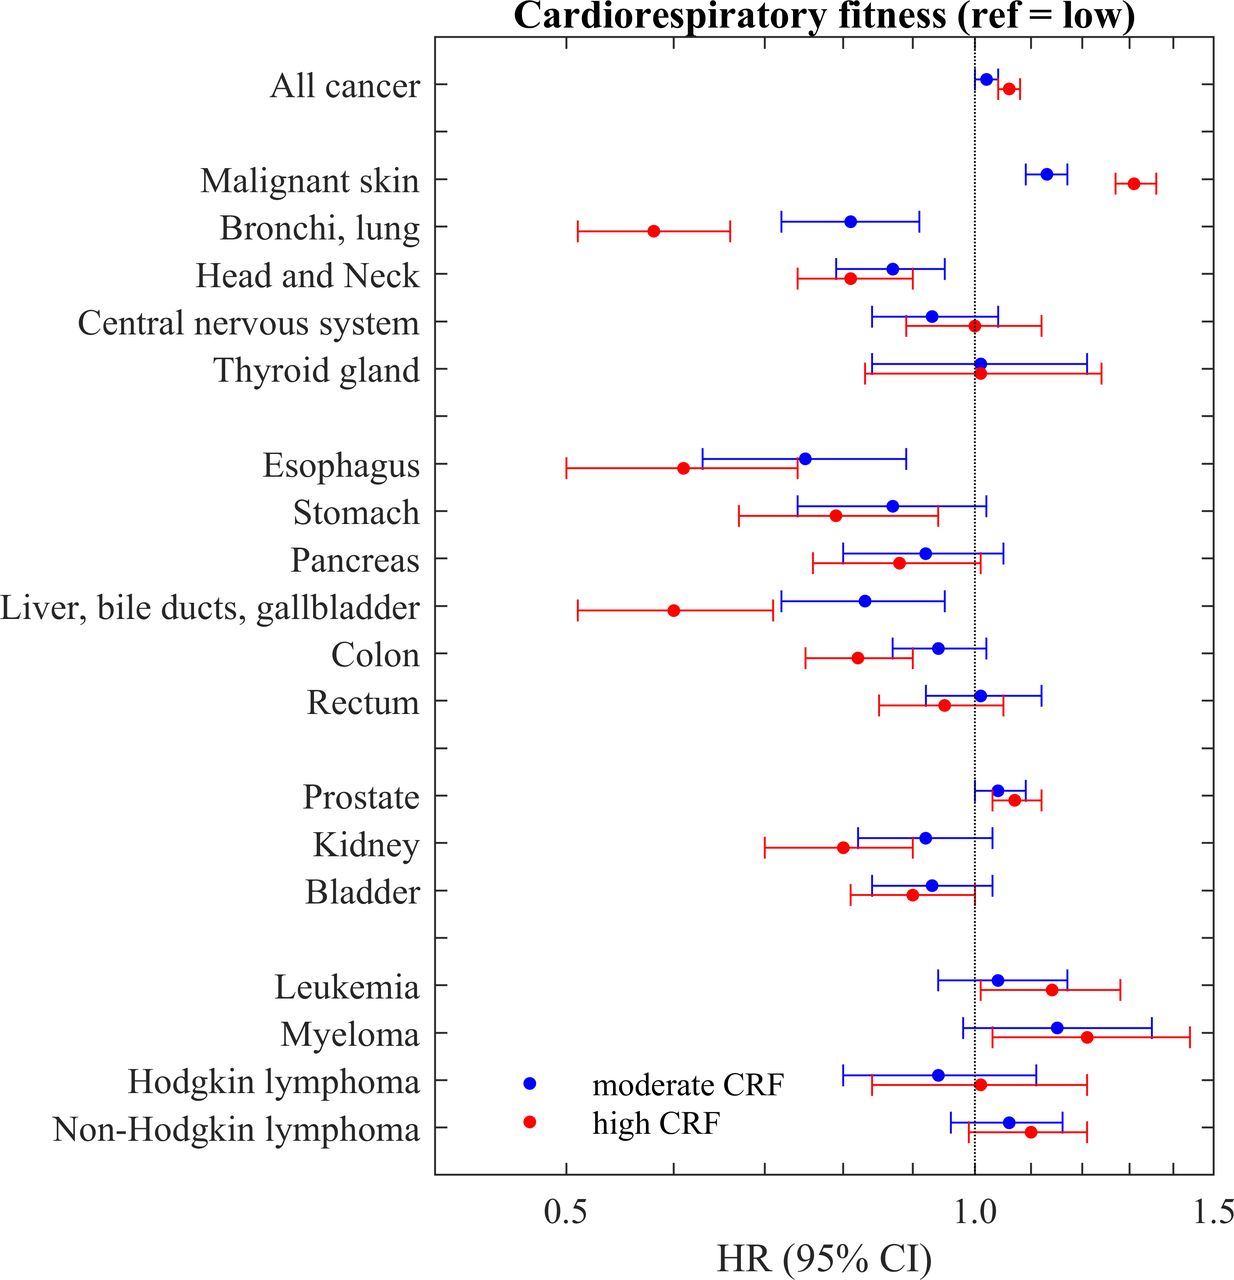
- Forest plot showing the results for cardiorespiratory fitness at conscription and incidence of site-specific cancer. Source:
- Combined Impact of Health Behaviours and Mortality in Men and Women
- In these middle-aged and older men and women, four health behaviours—not smoking, not being physically inactive, having a moderate alcohol intake (1–14 units a week), and having a high fruit and vegetable intake (as indicated by plasma vitamin C level >50 micromol/l)—were combined into a simple pragmatic four-item health behaviour score that was inversely related with mortality over an average 11 y of follow-up. There was a strong trend of decreasing mortality risk with increasing number of positive health behaviours, with those who scored four having approximately one quarter the mortality risk of those who scored zero, equivalent to about 14 y difference in chronological age. Although the trends were strongest for deaths from cardiovascular causes, they were also apparent for deaths from cancer and from other causes. They were also consistent after stratifying by sex, age group, body mass index, and social class, and after exclusion of deaths in the first 2 y. In the individuals with prevalent disease who were not included in the main analyses, we also found similar trends in mortality with the health behaviour score. Source:

- Survival Function According to Number of Health Behaviours in Men and Women Aged 45–79 Years without Known Cardiovascular Disease or Cancer, Adjusted for Age, Sex, Body Mass Index and Social Class, EPIC-Norfolk 1993–2006.

"If exercise could be packed into a pill, it would be the single most widely prescribed and beneficial medicine in the nation."
Robert N. Butler M.D. - Director, National Institute on Aging. USA
Key documents that describe the benefits of exercise
Exercise - the Miracle Cure
Academy of Royal Medical Colleges. UK
http://www.aomrc.org.uk/reports-guidance/exercise-the-miracle-cure-0215/
Exercise is the Real Polypill
American Physiological Society
https://www.physiology.org/doi/full/10.1152/physiol.00019.2013
For an article that discusses the how the drug industry are trying develop drugs to mimic the benefits of exercise see the following link:
***** End of Page ***** Adverts by Google follow below. Reader clicks on these adverts partially fund this non profit site (and Google as well too). *****