Miscellaneous information
In the course of putting together this site I came across various pieces of information of interest which didn't seem strictly relevant to the focus of this site but which seemed worth profiling from a general health perspective so I created this tab as a home for the information:

- Superfoods
- For a video that considers the issue of whether there is any such thing as a superfood see the following link:
- Turmeric (Curcumin)
- For an overview about turmeric see the following link:

- For an article about turmeric see the following link:
- For information about consuming turmeric and increasing its bioavailability by consuming it with ground black pepper see the following link:

- Ginger
- The spicy heat in ginger is derived from the Gingerols it contains and different varieties contain different amounts. The drying and aging of ginger leads to the Gingerols being converted to Shogaols which provide greater spicy heat. So for the hottest spicy ginger you should seek out dried, well aged varieties which had a high Gingerol content when harvested however the latter two variables are difficult to find out.
- Cooking ginger reduces the spicy heat.
- A great way to make a spicy ginger drink is to pour boiling water over dried chopped ginger in a french press coffee pot.

- Olive oil
- For an article about olive oil see the following link:
- All-cause mortality risk according to tertiles of virgin olive oil consumption by body mass index, physical activity, and adherence to Mediterranean diet categories, in the ENRICA study = 12,161.
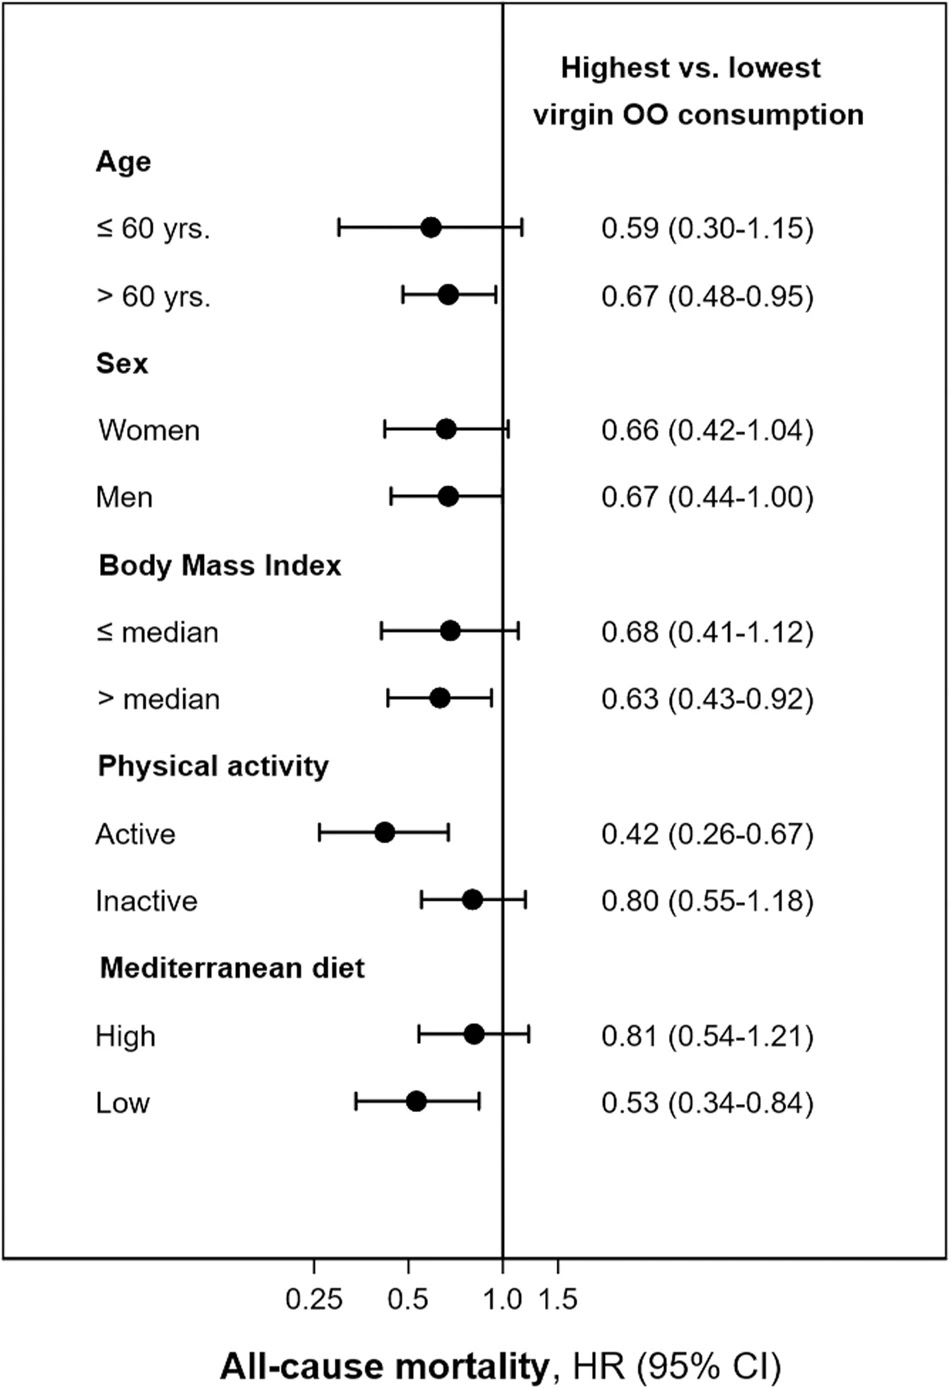
- Subgroup analyses were performed for total mortality, stratifying the population by possible effect modifiers such as sex, BMI (≤ or >26.3 kg/m2), total physical activity (≤ or >61.5 METs-hour/week) and adherence to the Mediterranean diet (≤ or >score 3). P for interaction was obtained for each subgroup analysis using the likelihood ratio test of models with and without the interaction term. Two items, alcohol and the ratio of monounsaturated/saturated fats were not included for the calculation of the Mediterranean Diet Score, thus the range in this modified score was from 0 (lowest adherence) to 7 (highest). The graph displays the hazard ratios (95% CI) for total mortality comparing the highest consumption of virgin olive oil (19 ± 12 g/day) with the lowest (<1 1="" activity="" adjusted="" age="" alcohol="" and="" bmi="" consumption="" continuous="" current="" day="" diet="" education="" educational="" energy="" excluding="" fats="" fiber="" for="" formal="" former="" g="" higher="" hours="" household="" in="" intake="" kcal="" kg="" leisure-time="" level="" m2="" medications="" mediterranean="" mets-hour="" monounsaturated="" never="" no="" number="" of="" or="" primary="" ratio="" saturated="" score="" secondary="" seven-point="" sex="" smoker="" smoking="" status="" total="" tv="" week="">3), hypertriglyceridemia (yes/no), hypercholesterolemia (yes/no), hypertension (yes/no), diabetes (yes/no), number of self-reported chronic conditions (0,1, and ≥2), and common olive oil consumption (g/day). The multiplicative interaction term between virgin olive oil consumption and the subgroup variable were for age (P value = 0.5132), for sex (P value = 0.596), for BMI (P value = 0.333), for total physical activity (P value = 0.045), and for adherence to Mediterranean Diet (P value = 0.129). Source:
- Potatoes
- For a video about whether potatoes are a healthy vegetable eating option see the following link:

- Blending food to make smoothies
- For a video about the impacts on food on blending it into a smoothie see the following link:
- Flavonoids (a type of Polyphenol which are also often referred to as antioxidants [probably because this is a property that is often measured and used as a proxy for "potency"])
- Flavonoids appear to have health benefits although how exactly they work appears to be unclear, for a video about this see the following link:
- https://www.youtube.com/watch?v=g1rj89J487c
- For an overview about the sate of the science in this area of nutritional science see the following link:
- For an overview about flavonoids see the following link:
- For a meta-analysis of prospective cohort studies which quantitatively assessed the association between flavonoid intake and mortality from cardiovascular disease and all-causes see the following link:
- https://clinicalnutritionespen.com/article/S2405-4577(16)30271-6/fulltext
- The conclusions indicate that a high intake of flavonoids is associated with reduced risk of mortality from cardiovascular disease and all causes in men and women. The results support recommendations of high fruit and vegetables intake as a part of a healthy diet.
- Sensitivity analysis that excluded one study at a time and estimated the pooled risk ratio with the remaining studies showed that the pooled risk ratios ranged from 0.84 (95% CI: 0.71, 0.98) to 0.88 (95% CI: 0.78, 0.99), which indicated robust results of the analysis of the highest flavonoid intake versus lowest from the studies examined.
- Subgroup analysis by class of flavonoids showed significant associations for most classes (flavan-3-ols, flavones, flavanones, anthocyanidins and proan-thocyanidins), except for two classes (flavonols and isoflavones) that showed non-significant associations.
- A significant risk reduction up to a daily flavonoid intake of about 170 mg was reported.
- The flavonoid overview link given above provides summary tables of flavonoid classes and foods that contain them with amounts of each flavonoid per 100g of the food. However determining what would be an optimal combination of foods and amounts is non straightforward which is why I would guess this study simply supports the recommendation of a high fruit and vegetable intake. The following link to a scientific review article supports this guess:
- For two linked videos about foods that provide the biggest nutritional impact for your money (determined from a oxygen radical absorbance capacity perspective) see the following links:
- For very detailed, albeit long, video discussions with two experts about a particular polyphenol (sulforaphane) which provides great insights into the complexity of the subject area see the following links:


- See the following link for a special issue of the "Nutrients" journal titled "Plant Food, Nutrition and Human Health" which aims to "shed light on how phytochemicals or plant bioactives are metabolized and turned into bioavailable molecules that are able to impact different biological processes related to human health".
- https://www.mdpi.com/journal/nutrients/special_issues/Plant_Food_Nutrition_and_Human_Health
- See the following link to the editorial article of special issue which provides and overview:
- For an article about the difficulties of nutritional research in this area see the following link:
- Sulforaphane
- Broccoli calabrese
- Broccoli is a good source of sulforaphane a which a lot of research suggests is very beneficial polyphenol (more in the head than the stems). Sulforaphane is relatively unstable and is produced when two chemicals in broccoli interact (glucoraphanin and myrosinase) when broccoli is broken up (e.g. by chewing). Myrosinase content is reduced by cooking which reduces the amount of sulforaphane available. This can be countered to an extent by sprinkling with ground brown mustard seed (a source of Myrosinase) to the cooked broccoli and lightly cooking it or alternatively eating it raw. However much greater sulforaphane is available from sprouted broccoli seeds. See the following links for a video about growing broccoli sprouts and an informative FAQs page about sulforaphane in general:


- Rocket, arugula, rucola leaf
- Rocket is also a good source of Sulforaphane and as it is usually eaten raw in a salad the impact of cooking does not need to be considered. For an article about rocket see the following link:
- Moringa oleifera leaf
- The leaf of this tree which is available dried / powdered is also a good source of sulforaphane. See the following link to research about the properties of the leaf associated with different means of consumption:


- Cinnamon

- To avoid toxicity issues use Ceylon Cinnamon (unless specifically detailed on the product packaging it is unlikely to be Ceylon Cinnamon). See the following link for a video about this:
- For an article about the benefits of cinnamon see the following link:

- Cocoa / chocolate

- The most effective form, from a maximum and unaltered flavonoid content perspective, is non "dutched" cocoa powder (the addition of alkalis, to reduce bitterness and improve solubility, is often added in processing and is termed dutching). For a scientific article about this see the following link:
- Cocoa is produced from cocoa beans by fermenting them, then roasting them, grinding them and then heating the grind to give a cocoa liquor (as a result of the fat melting) which is then usually pressed to separate the solids from the fat to produce cocoa powder and cocoa fat/butter respectively. Both these products can be referred to as cocoa mass/solids. These products may be further processed such as adding alkali to the cocoa powder as mentioned above. Chocolate is produced using one or more of these products and combining with other ingredients such as sugar, fat, flavourings and emulsifiers. The stated amount of cocoa mass/solids quoted on product label is therefore relatively meaningless from a flavonoid content perspective as this is determined primarily by the amount and quality of unprocessed cocoa powder in the chocolate which is rarely detailed on product labels. White chocolate does not typically contain any cocoa powder.
- For a video about this subject see the following link:
- For a video about consuming chocolate and what makes a good quality chocolate is see the following link:


- Green tea
- If you don't particularly like the flavour of green tea but do like the flavour of mint try Moroccan mint tea which is a blend of mint and green tea leafs.
- The taste also works after brushing teeth with mint based toothpastes and when unsweetened its' antibacterial properties may provide dental hygiene benefits.
- For a video about the possible health benefits and risks of green tea see the following link:
- Resveratrol

- For a videos about resveratrol see the following links:
- https://nutritionfacts.org/video/flashback-friday-the-best-source-of-resveratrol/
- https://nutritionfacts.org/video/side-effects-of-resveratrol-supplements/
- https://nutritionfacts.org/video/resveratrol-impairs-exercise-benefits/
- For the research about the blunting effects of resveratrol supplementation on exercise benefits see the following link:
- For an informed view about many supplements including resveratrol (at 34mins 20secs in) see the following link:


- Port wine
- Port is made by the fermentation of grapes that contain naturally occurring sugar in the form of glucose and fructose. The fermentation utilises the glucose first but then it is stopped by the addition of distilled alcohol in the production process to fortify the drink leaving the fructose in the port which provides the sweetness (fructose is relatively significantly sweeter than glucose and also has a flavour profile typically preferred over glucose by most consumers). As a consequence it is a drink relatively high in both alcohol and fructose. It also often has a lot of sediment in it that contains the dead yeast killed when the alcohol was added which contains purines derived from the yeast DNA. The metabolism of purine (derivation; pure urine), alcohol and fructose all produce uric acid (aka urate) via different metabolic pathways. Uric acid is mostly removed from the blood by the kidneys which passes it out of the body in urine. If the kidneys are unable to remove enough uric acid from the blood high levels can build up. High levels of uric acid in the blood (aka hyperuricemia) can have health consequences such as contributing/leading to inflammatory arthritis (gout).
- For an article about the amount of sugar in wine see the following link:
- https://winefolly.com/deep-dive/sugar-in-wine-chart/
- A couple of glasses of port contain about the same amount of fructose as about a litre of non diet cola.
- Gout
- For an overview video about gout see the following link:
- For a scientific review of gout see the following link:
- For articles about gout and genetics see the following links:

- https://blog.23andme.com/health-traits/a-23andme-gout-out/
- https://blog.23andme.com/health-traits/how-23andme-predicted-my-likelihood-of-developing-the-disease-of-kings/
- For a scientific article about gout and nutrition see the following link:

- For research about the consumption of sucrose-sweetened soft drinks increasing blood levels of uric acid see the following link:

- Changes in circulating levels of UA after the 6-month intervention. Forty-seven subjects were randomised to consume 1 l of SSSD (regular cola), semi-skimmed milk, diet cola or water daily for 6 months. A post hoc pair-wise comparison of the four groups using an unpaired t-test was performed and data are displayed as relative changes in plasma levels of UA for the four test beverages in relation to baseline values. Data are displayed as mean±s.e.m, *P=0.02, **P=0.009 and ***P=0.002 as compared with the relative change in UA in the SSSD group.
- For a (long) video about uric acid and its impact on health see the following link:
- https://youtu.be/QZ6jPCcFNa8
- Even in the normal range, having higher serum urate could be a risk for hypertension, dyslipidemia, and CKD. The optimal serum urate range, which conferred the lowest risk for developing cardiometabolic diseases, could be less than 5 mg/dL for men and 2–4 mg/dL for women in a generally healthy population. These findings suggest that routine screening of serum urate is useful as a predictor for cardiometabolic diseases in primary care settings. Source:
- Vitamin and supplement product testing
- For a website that provides information about vitamin and supplement products derived from laboratory testing see the following link:
- Vitamin D3
- For an article that discusses the benefits of Vitamin D supplementation but which also provides links to evidence against and side effect information see the following link:
- For an informed video debate about Vitamin D from two different perspectives see the following link:
- https://youtu.be/aCAvvZXUW08
- For a video that addresses the issue of the apparent Vitamin D paradox see the following link:
- For a video about Vitamin D tests, blood levels and doses see the following link:
- For an article about sunscreen and the impact it has on the bodies ability to naturally produce Vitamin D from the sun see the following link:
- For a detailed video about how Vitamin D is understood to work in the context of Covid-19 see the following link:
- For observational study research about the; Association of Serum 25-Hydroxyvitamin D Concentrations With All-Cause and Cause-Specific Mortality Among Adult Patients With Existing Cardiovascular Disease:

- Dose-response curves for serum 25(OH)D concentrations and all-cause and cardiovascular mortality. Hazard ratios (blue lines) and 95% confidence intervals (light blue shade) were adjusted for age (continuous), sex (male, female), and ethnicity (White, mixed, Asian, Black, Chinese, others, or unknown), education (college or university, vocational qualification, upper secondary, lower secondary, others, or unknown), Townsend deprivation index (in quintiles), household income (<18 18="" 31="" 52="">1,00,000 £, or unknown), smoking status (never smoker, former smoker, current smoker, or unknown), alcohol consumption (0, 0.1–4.9, 5.0–14.9, 15.0–19.9, 20.0–29.9, ≥30.0 g/day, or unknown), physical activity (inactive group, insufficient group, active group, or unknown), healthy diet score (in quintiles), and BMI (<18 .5="" 1.0="" 1.73="" 18.5="" 23.0="" 25.0="" 30.0="" 5.0="" 60.0="" and="" antihypertensive="" bmi="" body="" c-reactive="" c="" cancer="" cardiovascular="" cholesterol="" creatinine="" cvd="" cystatin="" diabetes="" disease="" duration="" egfrcr-cys="" equation="" estimated="" filtration="" glomerular="" history="" hypertension="" in="" index="" insulin="" kg="" lowering="" m2="" mass="" medication="" min="" ml="" no="" none="" of="" only="" or="" oral="" per="" protein="" quintiles="" rate="" use="" years="" yes="">
- The association of genetically predicted 25-(OH)D with all-cause mortality was L-shaped (P for nonlinearity < 0.001), and risk for death decreased steeply with increasing concentrations until 50 nmol/L. Evidence for an association was also seen in analyses of mortality from cancer, CVD, and respiratory diseases (P ≤ 0.033 for all outcomes). Odds of all-cause mortality in the genetic analysis were estimated to increase by 25% (odds ratio, 1.25 [95% CI, 1.16 to 1.35]) for participants with a measured 25-(OH)D concentration of 25 nmol/L compared with 50 nmol/L. Source:
- https://www.acpjournals.org/doi/10.7326/M21-3324
- The 35 SNPs used in the Vitamin D genetic score (detailed in the research Supplementary Data document) were:
- rs6671730, rs35408430, rs7522116, rs7528419, rs1933064, rs76798800, rs6672758, rs727857, rs1047891, rs2012736, rs6782190, rs705117, rs1352846, rs78151190, rs75741381, rs12056768, rs77532868, rs12794714, rs61891388, rs1660839, rs12803256, rs12798050, rs72997623, rs1149605, rs10859995, rs8018720, rs261291, rs77924615, rs212100, rs10426, rs6123359, rs17216707, rs2585442, rs2762943, rs2074735.
- For research about Vitamin D levels in traditionally living populations in East Africa see the following link:
- Vitamin K2

- For an article about Vitamin K including information on vitamin K2 see the following link:
- For an article about Natto see the following link:
- The relative risk (RR) of CHD mortality was reduced in the mid and upper tertiles of dietary menaquinone (Vitamin K2) compared to the lower tertile [RR = 0.73 (95% CI: 0.45, 1.17) and 0.43 (0.24, 0.77), respectively]. Intake of menaquinone was also inversely related to all-cause mortality [RR = 0.91 (0.75, 1.09) and 0.74 (0.59, 0.92), respectively] and severe aortic calcification [odds ratio of 0.71 (0.50, 1.00) and 0.48 (0.32, 0.71), respectively]. Phylloquinone (Vitamin K1) intake was not related to any of the outcomes. These findings suggest that an adequate intake of menaquinone could be important for CHD prevention. Source:

- https://academic.oup.com/jn/article/134/11/3100/4688389
- The study was undertaken in Rotterdam in the Netherlands and the main dietary source of Vitamin K2 appears to have been cheese. Natto has approximately 10 to 30 times more Vitamin K2 than cheese. Source:

- A salad of rocket and parmesan cheese should be a good source of Vitamin K1 and K2 and when combined with an olive oil and balsamic vinegar dressing makes a classic Italian salad.


- Omega3s
- For a summary of key research about Omega 3 see the following link:

- For a summary of key research about Omega 3 with a food source context see the following link:
- For a meta-analysis that assessed the effects of increased intake of fish‐ and plant‐based omega‐3 fats for all‐cause mortality, cardiovascular events, adiposity and lipids see the following link:
- https://www.cochranelibrary.com/cdsr/doi/10.1002/14651858.CD003177.pub5/full
- The "Implications for practice" section clearly explains the balance of issues to consider.
- For an article about fish oil supplements see the following link:
- I could not make my mind up about Omega 3 supplementation until I saw the (nearly 2 hour long) video which you can find via the following link:

- Omega-3 fatty acid levels are inversely associated with mortality and with incident cardiovascular disease
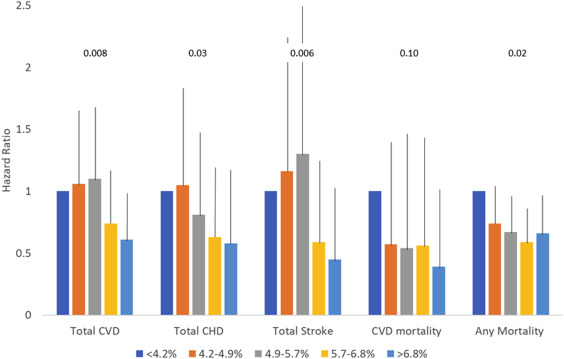
- Relations between quintiles of the Omega-3 Index and hazard ratios (+95% confidence interval) for death from CVD (n = 58), cancer (n = 146), other causes (n = 128), and all causes (n = 350, including 18 of unknown causes). Data are from 2500 participants free of baseline CVD followed for a median of 7.3 years. Adjusted for all variables in Table 1. P-values for trend are shown above the columns. CVD, cardiovascular disease; CHD, coronary heart disease. Source:
- Vitamin D3 / omega3s / simple exercise
- For a video about research into the taking vitamin D3, omega3s and simple exercise alone and in combinations to prevent cancer in 70 year and older adults see the following link:

- Primary endpoint—effect of treatments on the prevention of any invasive cancer. Cox-proportional hazard model adjusted for history of cancer, sex, BMI, prior fall, age, and study center. The comparison group is always the group that does not have the respective treatment(s) of interest. For all three treatments, it is the group who received only the placebo. All verified new invasive cancer cases (n = 81) among all 2,157 participants. Abbreviation: SHEP, Simple home exercise program.
- For the research paper which the above video reports upon and the source of the above table see the following link:
- For a research paper that describes the wider clinical trial with dose information including the dose rational see the following link:
- Vitamin B12

- For a video about vitamin B12 see the following link:
- Multivitamin supplements
- For systematic reviews of the research about antioxidant supplements see the following links:
- https://www.cochranelibrary.com/cdsr/doi/10.1002/14651858.CD007176.pub2/full
- https://journals.plos.org/plosone/article?id=10.1371/journal.pone.0056803
- For a video that discusses, vitamins, minerals, multivitamins and supplements see the following link:
- https://youtu.be/N83s8pz3_zw
- Comparison of Multivitamin-Mineral Supplements Administered in COSMOS and Physicians’ Health Study II mentioned in the video:

- From the Supplemental Materials in the Supporting Information section of the following source:
- For the COSMOS Trial website see the following link:
- For an article that discusses multivitamins see the following link:
- https://www.healthline.com/health-news/multivitamins-dont-provide-many-health-benefits-researchers-say
- If you restrict your food intake on a low calorie diet taking a daily multivitamin tablet for the duration should mean that no deficiencies occur.
- For a good value multivitamin product available in the UK that seems to be comprehensive and provide doses consistent with health guidance see the following link:
- https://www.waitrose.com/ecom/products/waitrose-a-z-multivitamins/822149-236342-236343
Typical values per tablet Vitamin A 800µg RE 100% of NRV Vitamin D 5µg 100% of NRV Vitamin E 12.0mg a-TE 100% of NRV Vitamin K 75.0µg 100% of NRV Vitamin C 80.0mg 100% of NRV Thiamin 1.1mg 100% of NRV Riboflavin 1.4mg 100% of NRV Niacin 16.0mg NE 100% of NRV Vitamin B6 1.4mg 100% of NRV Folic Acid 200.0µg 100% of NRV Vitamin B12 2.5µg 100% of NRV Biotin 50.0µg 100% of NRV Pantothenic Acid 6.0mg 100% of NRV Calcium 200.0mg 25% of NRV Magnesium 100.0mg 27% of NRV Iron 14.0mg 100% of NRV Zinc 10.0mg 100% of NRV Copper 1000.0µg 100% of NRV Manganese 2.0mg 100% of NRV Selenium 55.0µg 100% of NRV Chromium 40.0µg 100% of NRV Molybdenum 50.0µg 100% of NRV Iodine 150.0µg 100% of NRV
- For a web page that lists the supplements taken by a respected health optimisation doctor see the following link (the web site has information on other health influencers too):
- Oats

- If you eat oats for their potential health benefits you may wish to consider which processed form you consume. Oatmeal (pinhead / steel cut) and oat bran appear to offer the greatest health benefits but provide different nutrient profiles. See the following link for information about oat bran:

- Optimal metabolic health biomarkers

- For a video about metabolic health see the following link:
- For a very long but very comprehensive video about key longevity issues to be aware of see the following link:
- Cholesterol
- Determined from a lipids blood test.
- For a short article about foods that can lower non-HDL cholesterol see the following link:
- For an article that provides key information about cholesterol see the following link:
- https://www.healthline.com/nutrition/how-to-lower-cholesterol
- For further detail see the following links to two research articles:
- For a web based unit conversion calculator see the following link:
- Application of non-HDL cholesterol for population-based cardiovascular risk stratification: results from the Multinational Cardiovascular Risk Consortium (published in 2019).
- Added value of this study
- To our knowledge, our study provides the most comprehensive analysis of long-term risk for cardiovascular disease related to non-HDL cholesterol and offers an easily applicable tool to assess the long-term probabilities for cardiovascular disease events associated with non-HDL cholesterol. On the basis of a derivation and validation approach to risk prediction, our data provide robust multinational information. By using an up-to-date multinational population-based pooled cohort dataset, we provide a model that calculates the potential benefit of an early lipid-lowering strategy in individuals without prevalent cardiovascular disease across a range of non-HDL cholesterol categories.
- Source:

- Sex-specific linear association of non-HDL cholesterol and cardiovascular disease risk (winsorised at 1·6 and 8·5 mmol/L). The Cox model used is adjusted for age, sex, study cohort, smoking, diabetes, body-mass index, systolic blood pressure, and antihypertensive medication. Non-HDL cholesterol was modelled using cubic splines. An interaction between sex and non-HDL cholesterol was included in the model. Median follow-up was 12·8 (IQR 7·5–18·4) years.

- Model of long-term cardiovascular disease risk prediction and the benefit of lipid reduction. Individual risk of fatal or non-fatal cardiovascular disease in women (A) and men (B) according to age, non-HDL cholesterol concentration, and the number of additional cardiovascular risk factors (daily smoking, arterial hypertension, diabetes, and obesity; white circle). The red circle represents the probability (%) of cardiovascular disease by the age of 75 years. The hypothetically achievable probability (%) for cardiovascular disease by the age of 75 years after 50% reduction of non-HDL cholesterol is given in the green circle.
- For the NHS National Institute for Health and Care Excellence (NICE) Clinical Knowledge System (CKS) section on Lipid modification - Cardiovascular disease (CVD) prevention see the following link:
- https://cks.nice.org.uk/topics/lipid-modification-cvd-prevention/
- For access to the QRISK assessment tool see the following link:
- For a videos about cholesterol and the optimum level see the following links:
- For a video about dietary cholesterol and potential health impacts see the following link:
- For research about the comparison between a specific cholesterol reducing diet and a statin on cholesterol see the following link:
- https://academic.oup.com/ajcn/article/81/2/380/4607446?login=false
- The cholesterol reducing diet (portfolio diet) was composed of:
- Plant sterols (1.0 g/1000 kcal).
- Soy-protein foods (including soy milks and soy burgers, 21.4 g/1000 kcal).
- Almonds (14 g/1000 kcal).
- Viscous fibers from oats, barley, psyllium, and the vegetables okra and eggplant (10 g/1000 kcal).
- For a short audio video about how to prevent heart disease see the following link:
- For a short audio video about heart disease diagnostic tests see the following link:
- For a video about lipid disorders see the following link:
- Statins
- For a concise and clear video about statins see the following link:
- https://youtu.be/R6FGaR7vOHk
- For a video with a slight difference of opinion see the following link:
- For a video about who should take statins see the following link:
- https://nutritionfacts.org/video/who-should-take-statins/
- For access to the risk assessment estimator tools mentioned in the video see the following links:
- https://tools.acc.org/ASCVD-Risk-Estimator-Plus/#!/calculate/estimate/
- https://reference.medscape.com/calculator/252/framingham-risk-score-2008
- http://www.reynoldsriskscore.org/
- For access to the scientific review research paper mentioned in the video about the symptomatic side effects in patients taking statins see the following link:
- For a video about how risks can be conveyed in different ways about taking statins see the following link:
- https://nutritionfacts.org/video/the-true-benefits-vs-side-effects-of-statins/
- For access to the Mayo Clinic Statin Choice Decision Aid mentioned in the video see the following link:
- For an article about statins from the perspective of understanding risk see the following link:
- Effect of Statins on All-Cause Mortality in Adults
- In conclusion, statin use was associated with a significant reduction in all-cause mortality in various populations treated in real-world clinical practice in an analysis of over 4 million patient-years. It remains unclear whether the reduction in mortality risk associated with statins is solely due to a reduced incidence of cardiovascular death or other effects of these medications. Substantial heterogeneity limits the available evidence on the association between statin use and all-cause mortality in real-world practice. Source:

- Bubble plots for the association between statin use and all-cause mortality regressed against the percentage of men (A,B), mean age (C,D), year of publication (E,F), average follow-up (G,H), and number of deaths per 1000 patient-years (I,J). Plots on the left represent the primary meta-analysis, whereas plots on the right represent the meta-analysis after the exclusion of influential studies. Bubble size represents study weight.

- Grapefruit
- For a video about grapefruit and its effect on medications see the following link:
- Blood triglycerides
- Determined from a lipids blood test.
- For a web based unit conversion calculator see the following link:

- Pooled relative risks of CVDs and all-cause mortality by blood TG levels. Source:
- Effects of blood triglycerides on cardiovascular and all-cause mortality: a systematic review and meta-analysis of 61 prospective studies
- Aspirin for heart attack
- For information about taking aspirin as immediate first aid for a heart attack see the following link:
- Red and processed meats
- For some insights about the association between red and processed meat consumption and cancer risk see the following video link:
- Nitrate and Nitrite additives in processed meat
- Nitrates and nitrites are often added to processed meats to improve food quality and protect against microbial contamination but they are a source of N-nitroso compounds (NOCs) which are known carcinogens. However alternatives are available without the risks. See the following links to an article and then a concise scientific review which provides further details:


- For an article about French health authorities confirming the link between nitrites added to processed meat and colon cancer see the following link:
- Salt and sodium

- Adults need about 1g of salt per day, about a pinch, for our bodies to function.
- For a concise set of frequently asked questions about salt and health see the following link which is also the source of the above statement:
- Processed foods often have a relatively large amount of salt added as it is a major flavour enhancer particularly for those foods (which are often cheap) that start out bland. As a result if processed foods are part of your diet it is easy to consume in excess of 1g of salt per day.
- For concise videos about salt and food see the following links:
- https://nutritionfacts.org/video/flashback-friday-big-salt-getting-to-the-meat-of-the-matter/
- https://nutritionfacts.org/video/fewer-than-1-in-5000-meet-sodium-and-potassium-recommended-intakes/
- https://nutritionfacts.org/video/are-potassium-chloride-salt-substitutes-effective/
- The Salt Substitute and Stroke Study (SSaSS), the largest ever trial of a potassium salt substitute, showed clear blood pressure-mediated protective effects for stroke, major cardiovascular events and premature death. See the following link to the research abstract:
- https://nutritionfacts.org/video/potassium-chloride-salt-substitute-side-effects/


- Salt intake and risk of death. Spline plot of all-cause mortality (log scales) against salt intake in the follow-up study of Trials of Hypertension Prevention. Data from 2974 participants who were not in the salt reduction group, followed up for 23–26 years post-trial, adjusted for age, sex, race/ethnicity, clinic, treatment assignment, education status, baseline weight, alcohol use, smoking, exercise, and family history of cardiovascular disease. Rug plots indicate the distribution of estimated salt intake. Source:

- Adding salt to foods and hazard of premature mortality. Source:
- Higher sodium and lower potassium intakes, as measured in multiple 24-hour urine samples, were associated in a dose–response manner with a higher cardiovascular risk.

- Spline Plots for the Associations of 24-Hour Urinary Sodium and Potassium Excretion and Sodium-to-Potassium Ratio with Cardiovascular Risk:
- The spline analysis of pooled data supported a linear association over the range of sodium excretion (Panel A; 5th to 95th percentile, 1846 to 5520 mg) and potassium excretion (Panel B; 5th to 95th percentile, 1462 to 3961 mg) within the overall study population. The sodium-to-potassium ratio (Panel C) was assessed on the basis of the sodium and potassium excretion measured in millimoles. Hazard ratios were estimated from Cox models stratified according to study cohort with adjustment for age, sex, race, educational level, height, body-mass index, alcohol consumption, smoking status, physical activity, history of diabetes and elevated cholesterol status, family history of cardiovascular disease, and mutual adjustment for 24-hour urinary potassium and sodium excretions. Shaded areas indicate 95% confidence intervals, and the dashed line at 1.0 indicates the reference. Box plots at the bottom of the graphs show the distributions of the urinary biomarker. The vertical bar indicates the median, and the ends of the box the interquartile range; the whiskers (dashed lines) extend to values no farther than 1.5 times the interquartile range (which may be past the graphed area), and dots indicate values that are farther than 1.5 times the interquartile range. The 5th, 25th, 50th, 75th, and 95th percentiles (P5, P25, P50, P75, and P95, respectively) are shown at the bottom of each graph. Source:
- Low sodium salt substitutes(LSSS): a tool for sodium reduction and cardiovascular health.
- ...The Cochrane systematic review and meta‐analysis by Brand and colleagues examined the evidence regarding the use of LSSS on cardiovascular health in adults and children, and included blood pressure as a primary outcome. Importantly, the review also examined potential adverse effects including high levels of potassium in the blood (hyperkalaemia), which can cause potentially dangerous abnormal heart rhythms...
- ...Meta‐analyses demonstrated a mean reduction in systolic blood pressure of 4.76 mmHg (95% confidence interval (CI) 3.50 lower to 6.01 lower) and diastolic blood pressure of 2.43 mmHg (95% CI 3.50 lower to 1.36 lower) with the use of LSSS. Meta‐analyses also showed small decreases in non‐fatal stroke (rate ratio 0.90, 95% CI 0.80 to 1.01), non‐fatal acute coronary syndrome (rate ratio 0.70 95% CI 0.52 to 0.94) and cardiovascular mortality (rate ratio 0.77 95% CI 0.60 to 1.00) in adults...
- ...This review provides valuable evidence for policymakers in support of their efforts to reduce sodium intake. Although the review authors conclude that the 4.8 mmHg reduction in systolic blood pressure was not clinically meaningful (having prespecified a clinically meaningful reduction to be at least 10 mmHg), a reduction in blood pressure of this magnitude is consistent with reductions seen with the use of several classes of antihypertensive medications and is likely to be associated with substantial benefits at a population level. For example, a meta‐analysis of trials of antihypertensive drugs showed a mean reduction of systolic blood pressure using ACE inhibitors of 4 mmHg, which was associated with reductions in stroke (20%) heart failure (21%), acute coronary syndrome (13%) and major cardiovascular events (17%). Observational studies have demonstrated substantial reductions in CVD mortality with systolic blood pressure going down to 115 mmHg, and there is clear evidence that blood pressure reductions such as those demonstrated in this review are likely to have a positive impact on population cardiovascular health...
- Source:
- Blood pressure

- Home blood pressure (BP) monitoring (HBPM)
- Home BP is the average of all BP readings performed with a semiautomatic, validated BP monitor, for at least 3 days and preferably for 6–7 consecutive days before each clinic visit, with readings in the morning and the evening, taken in a quiet room after 5 min of rest, with the patient seated with their back and arm supported. Two measurements should be taken at each measurement session, performed 1–2 min apart.(57) Compared with office BP, HBPM values are usually lower, and the diagnostic threshold for hypertension is >_135/85 mmHg (equivalent to office BP >_140/90 mmHg) (Table 9) when considering the average of 3–6 days of home BP values. Compared with office BP, HBPM provides more reproducible BP data and is more closely related to HMOD, particularly LVH.(58) Recent meta-analyses of the few available prospective studies have further indicated that HBPM better predicts cardiovascular morbidity and mortality than office BP.(59) There is also evidence that patient self-monitoring may have a beneficial effect on medication adherence and BP control,(60,61) especially when combined with education and counselling.(62) Telemonitoring and smartphone applications may offer additional advantages,(63,64) such as an aid to memory to make BP measurements, and as a convenient way to store and review BP data in a digital diary and transmit them. We do not recommend the use of apps as a cuff-independent means of measuring BP.

- For a site that provides listings of blood pressure devices validated in the USA see the following link:

- Source:
- 2018 ESC/ESH Guidelines for the management of arterial hypertension: The Task Force for the management of arterial hypertension of the European Society of Cardiology (ESC) and the European Society of Hypertension (ESH):
- Cuff on the left arm or right arm?
- Blood pressure should be assessed in both arms and readings from the higher reading arm should be used.

- Normal daily blood pressure variation

- For an article about the importance of having a correct cuff size on a blood pressure monitor see the following link:
- For research that suggests that the reduction of systolic blood pressure reduced the risk of major cardiovascular events irrespective of previous diagnoses of cardiovascular disease and even at normal or high-normal blood pressure values see the following link:
- https://www.thelancet.com/journals/lancet/article/PIIS0140-6736(21)00590-0/fulltext
- In this largest source of randomised evidence of blood pressure-lowering effects on cardiovascular disease and death, we found the proportional effects of blood pressure-lowering on cardiovascular outcomes to be similar in people with or without previous cardiovascular disease and across categories of baseline systolic blood pressure down to less than 120 mm Hg. On average, a 5 mm Hg reduction of systolic blood pressure reduced the risk of a major cardiovascular event by about 10%; the corresponding proportional risk reductions for stroke, heart failure, ischaemic heart disease, and cardiovascular death were 13%, 13%, 8%, and 5%, respectively.
- For a lecture from one of the main authors of the above study see the following link:
- For a short video about blood pressure see the following link:
- For a video discussion about blood pressure (from 1 hour and 44 minutes in) with some key insights see the following link:
- For another video discussion about blood pressure (from 1 hour and 17 minutes in) with further key insights see the following link:
- https://youtu.be/vxA2jKZylnE
- For the research details of the research trial mentioned in the video see the following link:
- For a scientific article about weight loss and blood pressure see the following link:
- The relative impact of factors that impact blood pressure

- The Zoe Health Blood Pressure study. Source:
- The best nonpharmacological interventions that impact blood pressure

- *Type, dose, and expected impact on BP in adults with a normal BP and with hypertension.†In the United States, one “standard” drink contains roughly 14 g of pure alcohol, which is typically found in 12 oz of regular beer (usually about 5% alcohol), 5 oz of wine (usually about 12% alcohol), and 1.5 oz of distilled spirits (usually about 40% alcohol).
- Nonpharmacological interventions are effective in lowering BP, with the most important interventions being weight loss, the DASH (Dietary Approaches to Stop Hypertension) diet, sodium reduction, potassium supplementation, increased physical activity, and a reduction in alcohol consumption. Various other nonpharmacological interventions have been reported to lower BP, but the extent and/or quality of the supporting clinical trial experience is less persuasive. Such interventions include consumption of probiotics; increased intake of protein, fiber, flaxseed, or fish oil; supplementation with calcium or magnesium; and use of dietary patterns other than the DASH diet, including low-carbohydrate, vegetarian, and Mediterranean diets. Stress reduction is intuitively attractive but insufficiently proved, as are several other interventions, including consumption of garlic, dark chocolate, tea, or coffee. Behavioral therapies, including guided breathing, yoga, transcendental meditation, and biofeedback, lack strong evidence for their long-term BP-lowering effect. The best proven nonpharmacological measures to prevent and treat hypertension are summarized in the table above. Source:
- For the abstract to a research paper about the genetics associated with blood pressure traits see the following link:
- Associations between height and blood pressure

- Predicted brachial artery blood pressure differences (ΔBP, short–tall BP) between the 5th and 95th height (man, 161.8 and 188.1 cm, respectively; woman, 150.0 and 173.0 cm, respectively) percentiles for a representative adult male (BMI, 25 kg/m2; % body fat, 25) and female (BMI, 25 kg/m2; % body fat, 40) at 3 ages. A race × height interaction was present for female PP and the predicted ΔBP was derived using values for non-Hispanic White. Variations in predicted ΔBP values for women of other race/ethnic groups are given in Section 3. BMI = body mass index, BP = blood pressure, DBP = diastolic blood pressure, MBP = mean arterial blood pressure, PP = pulse pressure, SBP = systolic blood pressure. Source:
- Blood pressure with aging

- Multivariable-adjusted sex-specific trajectories of blood pressure (BP) with aging. The BP trajectories adjusted for multiple risk factors (body mass index, total cholesterol, diabetes, and smoking status). Although BP trajectories in both sexes were attenuated with multivariable adjustment, consistent with the known contributions of risk factors to age-related BP elevation, between-sex differences in all BP trajectories persisted. P values are for sex differences in the BP trajectories. DBP indicates diastolic blood pressure; SBP, systolic blood pressure. Source:
- The effect of a dietary supplement of potassium chloride or potassium citrate on blood pressure.
- WARNING: Too high a level of potassium in your blood is life threatening.

- Average blood pressure over the 6-week intervention period (♦, systolic blood pressure; ▲, diastolic blood pressure; ■, MAP, mean arterial pressure) for the three treatment groups (placebo, A; KCl, B; potassium citrate, C). Values are means with their standard errors depicted by vertical bars. Estimates for differences within each treatment group were assessed by the paired t test, while between groups were assessed by ANOVA. Mean values were significantly different from baseline (within-group comparison): **P < 0·05, **P < 0·01, ***P < 0·005. There were no significant differences within and between the three groups other than stated. Source:
- For the USA National Institutes of Health information page on dietary Potassium see the following link:
- The effect of a reduction in alcohol consumption on blood pressure.
- In people who drank (1 drink=12 g pure alcohol) two or fewer drinks per day, a reduction in alcohol was not associated with a significant reduction in blood pressure; however, in people who drank more than two drinks per day, a reduction in alcohol intake was associated with increased blood pressure reduction. Reduction in systolic blood pressure (mean difference −5·50 mm Hg, 95% CI −6·70 to −4·30) and diastolic blood pressure (–3·97, −4·70 to −3·25) was strongest in participants who drank six or more drinks per day if they reduced their intake by about 50%. Source:
- Alcohol Intake and Blood Pressure Levels: A Dose-Response Meta-Analysis of Nonexperimental Cohort Studies
- Results: seven studies, with 19 548 participants and a median follow-up of 5.3 years (range, 4–12 years), were included in the analysis. We observed a substantially linear positive association between baseline alcohol intake and changes over time in SBP and DBP, with no suggestion of an exposure-effect threshold. Overall, average SBP was 1.25 and 4.90 mm Hg higher for 12 or 48 grams of daily alcohol consumption, compared with no consumption. The corresponding differences for DBP were 1.14 and 3.10 mm Hg. Subgroup analyses by sex showed an almost linear association between baseline alcohol intake and SBP changes in both men and women, and for DBP in men while in women we identified an inverted U-shaped association. Alcohol consumption was positively associated with blood pressure changes in both Asians and North Americans, apart from DBP in the latter group. Source:
- The effect of different exercise modes on blood pressure.
- Results: 270 randomised controlled trials were ultimately included in the final analysis, with a pooled sample size of 15 827 participants. Pairwise analyses demonstrated significant reductions in resting SBP and DBP following aerobic exercise training (−4.49/–2.53 mm Hg, p<0.001), dynamic resistance training (–4.55/–3.04 mm Hg, p<0.001), combined training (–6.04/–2.54 mm Hg, p<0.001), high-intensity interval training (–4.08/–2.50 mm Hg, p<0.001) and isometric exercise training (–8.24/–4.00 mm Hg, p<0.001). As shown in the network meta-analysis, the rank order of effectiveness based on the surface under the cumulative ranking curve (SUCRA) values for SBP were isometric exercise training (SUCRA: 98.3%), combined training (75.7%), dynamic resistance training (46.1%), aerobic exercise training (40.5%) and high-intensity interval training (39.4%). Secondary network meta-analyses revealed isometric wall squat and running as the most effective submodes for reducing SBP (90.4%) and DBP (91.3%), respectively. Source:


- Reductions in systolic blood pressure achieved by hypertensives with three isometric training sessions per week are maintained with a single session per week.
- Isometric handgrip or (wall) squat exercise performed three times per week produces reductions in systolic blood pressure (SBP) in adults with hypertension. We aimed to compare these interventions and the potential to retain benefits with one exercise session per week. We compared blood pressure changes following handgrip and squat isometric training interventions with controls in a randomized controlled multicentre trial in 77 unmedicated hypertensive (SBP ≥ 130 mmHg) adults. Exercise sessions were performed in the workplace and consisted of four repetitions—three sessions per week for the first 12 weeks (phase 1), and one session per week for the subsequent 12 weeks (phase 2). Office blood pressure (BP) was measured at baseline, post-phase 1 and post-phase 2. Post-phase 1, mean reductions in SBP were significantly greater in handgrip (–11.2 mmHg, n = 28) and squat (–12.9 mmHg, n = 27) groups than in controls (–.4 mmHg; n = 22) but changes in DBP were not. There were no significant within-group changes during phase 2 but SBP was 3.8 mmHg lower in the wall squat than the handgrip group—a small magnitude but clinically important difference. While both interventions produced significant SBP reductions, the wall squat appears to be more effective in maintaining benefits with a minimal training dose. The low time investment to achieve and retain clinically significant SBP reductions—42 and 12 min, respectively—and minimal cost, particularly of the wall squat, make it a promising intervention for delivery in public health settings. Source:
- https://onlinelibrary.wiley.com/doi/full/10.1111/jch.14621
- The wall squat group performed 4 repetitions of 2 min with 2 min rest between each repetition ultimately if able at a 95 degree angle (picture (A) below) progressing to it over many weeks incrementally from a higher angle (picture (B) below). Picture (C) shows the hand grip exercise also tested.

- For an article about isometric exercise that mentions the above research see the following link:
- For a video that explains the mechanisms of action of these types of exercises and there effect on blood pressure see the following link:
- For an article that explains how to do a range of isometric exercises see the following link:
- The effect of endurance exercise on (ambulatory recorded) blood pressure.
- Overall, endurance training induced a significant reduction in daytime SBP [-3.2 mmHg, 95% confidence interval (CI), -5.0 to-0.3] and daytime DBP (-2.7 mmHg, 95% CI, -3.9 to -1.5). No effect was observed on night-time BP. The findings from this meta-analysis suggest that aerobic endurance exercise significantly decreases daytime, but not night-time, ambulatory BP.
- The results were obtained with training programmes that involved dynamic endurance exercises for 30–60 min per session, 2–5 times per week, at an intensity between 50 and 75% of HRres, and lasting from 6 to 52 weeks.
- The magnitude of the BP reduction was significantly associated with the gain in VO2 peak.
- Abstract source:
- Effect of aerobic and resistance exercise training on high (ambulatory recorded) blood pressure.
- We found that aerobic training and resistance training were well tolerated. Both aerobic training and resistance training reduced daytime systolic ABP (-7.2 +/-7.9 and -4.4 +/-5.8 mmHg; P < 0.05) and 24-h systolic ABP (-5.6 +/-6.2 and -3.2 +/-6.4 mmHg; P < 0.05). Aerobic training and resistance training both improved brachial artery flow-mediated dilation... However, only aerobic training decreased markers of inflammation (C-reactive protein, monocyte chemoattractant protein-1, vascular cell adhesion molecule-1 and lectin-like oxidized LDL receptor-1) and endothelin-1 and increased nitrite and nitrate levels (P < 0.05).
- Healthcare providers should continue to emphasize aerobic training for hypertension management given the established role of nitric oxide, endothelin-1 and chronic low-level inflammation in the pathogenesis of cardiovascular disease. However, our study demonstrates that resistance training should also be encouraged for middle-aged hypertensive patients. Our results also suggest that even if patients are on antihypertensive medications, regular aerobic training and resistance training are beneficial for blood pressure control and cardiovascular disease risk reduction.
- Participants assigned to aerobic training or resistance training completed three exercise sessions/week over 12 weeks at our institution’s exercise facilities under the direct supervision of an exercise physiologist. Exercise sessions were preferably scheduled on Monday, Wednesday and Friday. Unless there was a schedule conflict, participants completed all sessions at the same time on the planned days between 0700 h and 1900 h. Prior to the 12 week exercise intervention, 1 week was provided to familiarize participants with the equipment and exercise protocols. Aerobic training was performed on a treadmill using a progressive exercise intensity starting at 60% of heart rate (HR) reserve and increasing by increments of 10% every 4 weeks to 80% of HR reserve over the 12-week intervention. Exercise sessions consisted of 5 min treadmill walking at a self-selected intensity, 45–50 min treadmill exercise at the prescribed intensity and 5 min cool down (stretching). HR was monitored during each aerobic training session using telemetry (Polar Electro Oy, Kempele, Finland). Resistance training consisted of two to three sets of eight to 20 submaximal repetitions of bench press, leg press, lat pull down, leg extension, shoulder press, leg curl, bicep curl and triceps extension. Two sets were performed in the first 6 weeks and three sets in the last six weeks separated by 120s rest between sets. To prevent excessive BP increases, repetitions ranged from 15 to 20 in the first 4 weeks, 10–15 in weeks four through eight and eight to 12 in weeks eight through twelve. The maximum weight that participants could move with good technique (without concentric failure) was used. In addition, three sets of 15 repetitions of abdominal crunches were performed during each session.
- Abstract source:
- Effect of resistance exercise training on high blood pressure.
- When comparing hypertension, the results of systolic blood pressure after strength training were significantly decreased by strength training compared to the baseline moment (mean difference = − 9.52; 95% CI − 12.89 to − 6.14; I2 = 90%; p < 0.00001...). ...significant associations between diastolic blood pressure and strength training (mean difference = − 5.19; 95% CI − 7.98 to − 2.39; I2 = 93%; p = 0.0003).
- The strongest effect of strength training on decreasing blood pressure was observed in protocols with a moderate to vigorous load intensity (> 60% of one-repetition maximum-1RM), a frequency of at least 2 times per week, and a minimum duration of 8 weeks. We concluded that strength training interventions can be used as a non-drug treatment for arterial hypertension, as they promote significant decreases in blood pressure. Source:
- For a concise video that explains the basics of blood pressure see the following link:
- For a comprehensive long video about blood pressure lowering (antihypertensive) medications see the following link:
- For the UK NHS National Institute for Health and Care Excellence (NICE) Clinical Knowledge Summary (CKS) about high blood pressure (hypertension) see the following link:

- For cardiovascular disease risk calculators see the following links:
- https://www.nhs.uk/conditions/nhs-health-check/check-your-heart-age-tool/
- https://qrisk.org/
- For the research upon which this calculator is based see the following link:
- The above calculator calculates 10 year risk. For the version that more informatively calculates lifetime risk (to a maximum age 99 and optionally a user set maximum age) see the following link:
- https://www.heartscore.org/en_GB
- https://ccccalculator.ccctracker.com/
- https://static.heart.org/riskcalc/app/index.html#!/baseline-risk
- http://www.reynoldsriskscore.org/
- For a long discussion about cardiovascular disease risk and risk calculators see the following link:
- For a video that explains about risk factors for heart disease see the following link:
- For a video that explains Atherosclerosis see the following link:
- For an article that discusses the lesser known risk factors for heart disease see the following link:
- For information about high blood pressure (hypertension) provided by a commercial clinical decision support supplier see the following link:
- Angiotensin-converting enzyme (ACE) inhibitors and angiotensin receptor blockers (ARBs) are often used interchangeably as anti-hypertensive medications, for an article that considers whether they should be see the following link:
- For details of a wearable blood pressure monitoring device see the following link:


- Blood sugar
- Determined by a HbA1c blood test which is used to measure the average level of glucose (sugar) in the blood (there are other ways of measuring glucose in the body but they tend to be more point in time focused).
- For a web based unit conversion calculator see the following link:
- See the link that follows for the source of all the HbA1c information given below:

- Mortality hazard risk ratios with 95% confidence intervals by HbA1c group for those with/without diabetes (HbA1c 5%-5.6%, no diabetes diagnosis [green bar], as reference), NHANES 1988-2015.
- Low HbA1c Levels in People Without Diabetes
- Note the U-shaped curve above. In people without diabetes, there is no agreed lower cut-off point for HbA1c. However, with the widespread use of HbA1c testing, low HbA1c values are often detected. The definition of low HbA1c varies from study to study, with researchers using 4%, 4.5% or even 5% as the cut-off point.
- Several research studies have suggested that with HbA1c, it is not a case of “the lower the better.” There are many medical conditions that affect red blood cell turnover, which can cause low HbA1c levels.
- In 2011, an expert group at the World Health Organization (WHO) agreed the HbA1c test could be used to diagnose diabetes and recommended 6.5% as the diagnostic cut-off point. However, a value of less than 6.5% does not exclude diabetes, and WHO’s group did not make any formal recommendations to interpret HbA1c levels below 6.5%. Consequently, the American Diabetes Association (ADA) and U.K. National Institute for Health and Care Excellence (NICE) have each defined its own cutoff points for pre-diabetes (see Table 2, below).


- For a video provides a detailed overview about type 2 diabetes see the following link:
- For research review about type 2 diabetes reversal see the following link:
- For research about type 2 diabetes reversal in a real world setting see the following link:
- https://journals.plos.org/plosmedicine/article?id=10.1371/journal.pmed.1004327
- For an article that discusses the research see the following link:
- Glycemic Control and Coronary Heart Disease Risk in Persons With and Without Diabetes

- Adjusted relative hazard of coronary heart disease in 1321 individuals without diabetes (A) and 1626 individuals with diabetes (B), adjusted for age, sex, and race and plotted on the log scale. All adjusted relative hazards are centered at hemoglobin A1c (HbA1c) = 5.2%, and the graphed lines are shown for the fifth to 95th percentiles of HbA1c level. The solid black line in A is from a single-knot linear spline model (knot at HbA1c = 4.6%). The dotted gray line is from a linear spline model with knots at the quintiles of HbA1c. In B, the solid black line is from a linear model; the gray dotted line is from a linear spline model with knots at the quintiles of HbA1c level. The normal range for HbA1c in persons without diabetes (4%-6%) is indicated by the dotted vertical lines in A. The current target for glycemic control in persons with diabetes (HbA1c = 7%) is indicated by the vertical dotted line in B. Source:
- Sex-specific risks for cardiovascular disease across the glycaemic spectrum.

- Sex-specific associations between glycated haemoglobin (HbA1c) and six cardiovascular diseases. Caption: ∗A composite measure of all examined outcomes. Notes: Sex-specific hazard ratios from Cox proportional hazards models, sequentially adjusted for age at study entry, socio-demographics (i.e., ethnicity and deprivation), lifestyle factors (i.e., smoking status, alcohol consumption, physical activity, body mass index, waist-hip ratio, processed meat and fruit and vegetable intake), and clinical characteristics (i.e., total cholesterol, estimated glomerular filtration rate, C-reactive protein, diagnosed hypertension, use of antihypertensive medication or statins, and family history of cardiovascular disease). Categories defined as follows: low-normal (<35 mmol/mol or <5.5%), pre-diabetes (42–47 mmol/mol or 6.0–6.4%), undiagnosed diabetes (≥48 mmol/mol or ≥6.5%), or diagnosed diabetes. Reference group: normal HbA1c (35–41 mmol/mol or 5.5–5.9%). Source:
- If you are interested in continuous glucose monitoring (CGM) see the following link to an article about it:

- For a video (the first section of a longer video that is paywalled) about continuous glucose monitoring and issues to consider before embarking on it see the following link:
- For a video (the first section of a longer video that is paywalled) about how a continuous glucose monitors work and the values typically produced see the following link:
- For a video that provides some context to CGM (later in the video) and discusses health monitoring in general see the following link:
- For a video that provides information about the use of CGMs and data issues to be aware of see the following link:
- If you are interested in how glucose levels vary throughout the day and what "normal" levels may be see the following link to some research:


- Mean continuous IG trace obtained by the microdialysis technique in healthy volunteers after ingestion of meals with identical carbohydrate amount, but with different fiber, protein, and fat content. Mean interstitial glucose trace ± 2 SD (corresponding to the 95% range), n = 23; Cap. BG: capillary blood glucose values, used for calibration of the tissue glucose monitoring device; Ven. BG: venous blood glucose values. Meal 1: rice pudding with sugar and cinnamon; meal 2: toast, honey, jam, curd cheese, and orange juice; meal 3: kidney beans, wholemeal bread, salami, cheese; and meal 4: grilled salmon, broccoli, carrots, wild rice, and cream. (Right) Areas under the curve (above baseline) after intake of standardized meals. Mean AUC ± SEM: AUC 0-1, 1-2, 2-3, 3-4, and 4-5 hours after start of meal (n = 23); **P < 0.01, ***P < 0.001 versus AUC 0-1 hour.
- To convert blood sugar/glucose from mg/dL (US standard) to mmol/L (UK standard) and vice versa see the following link to a converter:
- For a video about blood glucose levels and monitoring see the following link:
- Clinical Targets for Continuous Glucose Monitoring Data Interpretation: Recommendations From the International Consensus on Time in Range

- CGM-based targets for different diabetes populations. Source:
- If you think you have an excessive post meal glucose response this can be more rapidly brought down by undertaking some form of exercise such as a 45 to 60min walk or by exercising the soleus muscle in your calf if you need to remain more static, see the following link for the research on this:

- For a video about the consumption of vinegar to help with blood sugar control see the following link:
- For a video that discusses key biomarkers and variability cycles see the following link:
- Death rate by age group in England and Wales in 2015

- Physical and mental health conditions by age in the UK
- Example below for age range 80 years and older. For equivalent charts for age ranges 0-9, 10-19, 20-29, 30-39, 40-49, 50-59, 60-69 and 70-80 see the following link:

- Sex-standardised cumulative incidence (%) of the top 50 diseases and all cancers between April 1, 2010, and March 31, 2015, for individuals aged 80 years or more on April 1, 2010. AKI=acute kidney injury. BPH=benign prostatic hyperplasia. CIN=cervical intraepithelial neoplasia. CKD=chronic kidney disease. COPD=chronic obstructive pulmonary disease. GORD=gastro-oesophageal reflux disease. HDLC=high-density lipoprotein cholesterol. IBS=irritable bowel syndrome. ID=infectious disease. LDLC=low-density lipoprotein cholesterol. LRTI=lower respiratory tract infection. PCOS=polycystic ovary syndrome. PID=pelvic inflammatory disease. T1D=type 1 diabetes. T2D=type 2 diabetes. TIA=transient ischaemic attack. URTI=upper respiratory tract infection. UTI=urinary tract infection.

- What things are you most likely to die from and how to prevent them
- For a video on the above subject see the following link:
- Biomarker based biological age
- Chronological age is the strongest risk factor for most chronic diseases. Developing a biomarker-based age and understanding its most important contributing biomarkers may shed light on the effects of age on later-life health and inform opportunities for disease prevention. The biomarker ages, from research source provided below, described 44.0% and 51.3% of the variation in chronological age for healthy men and women, respectively with the principal biomarker components from the research shown in the charts below:

- Importance of the top 15 biomarker principal components in the biomarker ages for healthy men and women. The percentage of R2 denotes the percentage of variation in the biomarker age explained by each biomarker. Source:
- https://academic.oup.com/biomedgerontology/article/76/7/1295/6161283
- 72 UK biobank biomarkers were selected for analysis and 51 of these were ranked. Although the UK biobank appears to hold physical activity biomarker data this research does not appear to have considered this.
- Some of the biomarkers may be non modifiable and therefore unable to be impacted by individual change e.g. adult height, however its influence on a predisposition or not to certain diseases may inform opportunities for disease prevention. See the following link to research about this:
- https://bmcmedicine.biomedcentral.com/articles/10.1186/s12916-018-1175-7
- For more information about the impact of height on health see the following link to some research:

- Top phenome-wide associations and closely related traits with genetically predicted height.
- For information about UK biobank data including details of the biomarkers utilised in the above research see the following link:
- https://biobank.ndph.ox.ac.uk/ukb/
- Outside of the UK biobank research environment some of the biomarkers may be difficult to measure if the aim is to compare against UK biobank data e.g. the Reaction time and the Pairs matching test as they were tested in a laboratory environment with specific testing equipment. For reaction time however research is available that has made the comparison and provides access to the online research tool used to undertake the research unfortunately the tool combines a Reaction time test followed by a similar Pairs matching test but only provides a single result so the Reaction time test result cannot be split from the overall test score result provided. See the following link to the research:
- https://www.nature.com/articles/s41514-021-00067-6
- The online research test can be accessed from the following link:
- Phenotypic age biomarker based estimation

- For an on-line biological age calculator which uses the algorithm from the above research see the following link:
- For an article about one of the lead researchers involved in this research see the following link:
- For a video about biological age science which approaches the subject from a perspective of debunking the marketing hype around the subject area see the following link:
- For a video that discusses ageing biomarkers see the following link:
- Blood biomarker profiles and exceptional longevity: comparison of centenarians and non-centenarians

- In conclusion, already from age 65 onwards, a difference in commonly available biomarkers was observed between individuals who eventually became centenarians and those who did not. From a total of 12 blood-based biomarkers:
- Higher levels of:
- total cholesterol (TC) [metabolic status/function]
- iron [anaemia]
- Lower levels of:
- glucose [metabolic status/function]
- creatinine [kidney function]
- uric acid [inflammation]
- aspartate aminotransferase (ASAT) [liver function]
- gamma-glutamyl transferase (GGT) [liver function]
- alkaline phosphatase (ALP) [liver function]
- total iron-binding capacity (TIBC) [anaemia]
- lactate dehydrogenase (LD) [liver function]

- were associated with a greater likelihood of becoming a centenarian. While chance likely plays a role for reaching age 100, the differences in biomarker values more than one decade prior death suggest that genetic and/or lifestyle factors, reflected in these biomarker levels may also play a role for exceptional longevity. Our work - to date the largest study on this topic also shows that centenarians had homogeneous biomarker profiles which underscores the importance of specific biomarker characteristics in research on exceptional longevity. Source:

- Is sitting with crossed legs bad for you?
- For an article about this see the follwing link:
- Sparkling water
- The three sources listed below all show that all the plain sparkling waters tested had PH values greater than 4 therefore plain sparkling water would be classified as minimally erosive, using American Dental Association classifications which are: pH < 3.0 = Extremely erosive, pH = 3.0-3.99 = Erosive, pH >= 4.0 Minimally erosive.
- https://www.ada.org/en/~/media/ADA/Public%20Programs/Files/JADA_The%20pH%20of%20beverages%20in%20the%20United%20States
- https://www.mcgill.ca/oss/article/health-and-nutrition-quackery/carbonated-water-bad-your-teeth
- https://www.cambridge.org/core/services/aop-cambridge-core/content/view/95A6F71BD70F90A62EC1775C6FD1ED2B/S0007114511002820a.pdf/analysis_of_the_erosive_effect_of_different_dietary_substances_and_medications.pdf
- The PH of a liquid can be easily measured using a consumer PH meter.


- Fever
- For a video about whether you should treat the symptoms of a fever or not see the following link:
- For an article that provides information about what normal body temperature is and details the symptoms of fever see the following link:

- Face masks
- Covid-19: Upgrading to FFP3 respirators cuts infection risk, research finds. Source:
- https://www.bmj.com/content/373/bmj.n1663
- FFP3 masks are available with and without valves. Masks with valves provide increased user comfort and a high degree protection against Covid-19 infection via aerosols and fluids for the user but not the same level of protection against aerosols for others. See the following link to an NHS patient safety alert about the issue:
- For research about the airborne transmission of respiratory viruses see the following link:
- For a mask testing and review youtube video channel see the following link:
- https://www.youtube.com/user/coll0412/featured

- For a video that provides an analysis the different performance of different classification of masks and demonstrates the importance of mask fit see the following link:
- For a video and then an article (from different sources) that considers the outcome of overview research analysis on mask wearing see the following link:
- https://youtu.be/ETyV5j8VXpI
- https://sensiblemed.substack.com/p/lets-do-the-cochrane-review-of-physical
- For an article about further subsequent research on wearing face masks see the following link:
- For an article about the UK Royal Society review into the impact of non-pharmaceutical interventions in the Covid-19 pandemic see the following link:

- In addition to impeding the inhalation of pathogens wearing a mask also helps keep your nose at a higher temperature than without one which helps the body fight infection in the upper respiratory tract when one is acquired by providing a more hostile environment to the infecting pathogen(s).
- For research about the temperature of the upper respiratory tract and its impact on viral infections see the following link:
- Mouthwash
- For a video about whether to use mouthwash daily see the following link:
- HEPA14 air filtration

- Airborne severe acute respiratory syndrome coronavirus 2 (SARS-CoV-2) was detected in a coronavirus disease 19 (COVID-19) ward before activation of HEPA-air filtration but not during filter operation; SARS-CoV-2 was again detected following filter deactivation. Airborne SARS-CoV-2 was infrequently detected in a COVID-19 intensive care unit.
Bioaerosol was also effectively filtered. Source:

- Solid fuel stoves
- It appears that even the use of even modern wood and coal burning residential stoves can create high levels of indoor Particulate Matter air pollution well above World Health Organisation guideline safe levels. Research indicates that people inside homes with a residential stove are at risk of exposure to high intensities of particulate matter of sizes PM2.5 and PM1. The research reports that this can occur within a short period of time through normal use with the opening of the stove door to refuel being the primary mechanism for introducing PM into the home. See the following link to the research:

- https://www.mdpi.com/2073-4433/11/12/1326/htm
- The World Health Organisation guidelines for maximum mean Particulate Matter concentrations over 24 hours are:
- PM10 = 50 ug/m3
- PM2.5 = 25 ug/m3
- United States and western Europe background concentration, estimated at 3 – 5 ug/m3.
- PM1 = No guidance as, "While there is considerable toxico-logical evidence of potential detrimental effects of ultrafine particles on human health, the existing body of epidemiological evidence is insufficient to reach a conclusion on the exposure–response relationship to ultrafine particles."
- See the following link for the guidance:
- Particulate matter air content can be easily measured using a consumer air quality particulate matter monitor.
- You'll want to make sure there are no other sources of particulate matter air pollution in the room when taking readings (e.g. burning incense, candles, etc).

- For a video about particulate matter air pollution in general but which also covers cars see the following link:


- Jet lag
- For articles and a video about jet lag and how to reduce it see the following links:
- https://www.healthline.com/health/jet-lag#takeaway
- https://www.healthline.com/health/melatonin-for-jet-lag#prevention
- https://youtu.be/OIwHYaDyswA
- For information about dietary sources of melatonin see the following link to a research article, Table 1 in the document provides an extensive list of foods and their melatonin content:
- https://www.mdpi.com/2072-6643/9/4/367/htm

- Pistachio nuts contain the greatest melatonin concentration by a very significant margin. About 25g of pistachios may contain about 5g of melatonin. However the above document reports high individual variability of absorption of orally administered melatonin tablets from negligible to about 40% from small sample size studies. The bioavalibility of melatonin from pistachio nuts may also be less than from manufactured tablets.
- For videos about melatonin see the following links:

***** End of Page ***** Adverts by Google follow below. Adverts partially fund this non profit site (and Google as well too). *****